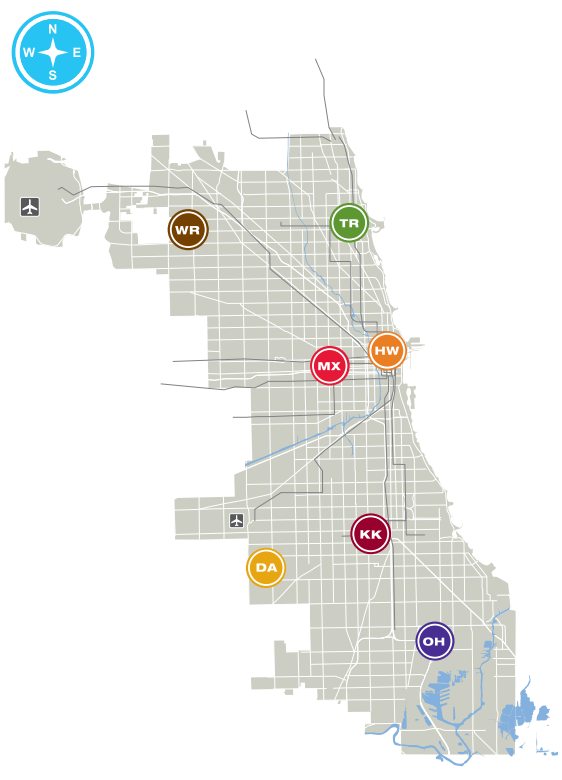
Section 7.6 Graphs in Action
Imagine you are a bike courier tasked with making deliveries to each City Colleges of Chicago (CCC) campus location. Per your contract, you get paid per delivery, not per hour. Therefore, finding the most efficient delivery route is in your best interest. We assume the bike delivery routes are the same distance in each direction.
Subsection 7.6.1 Bike Courier Delivery Route Problem
Let’s make a plan to solve our delivery route problem.
- Find the distances in miles between each CCC location.
- Make a graph of the CCC locations. Each location is a node. Each edge is a bike route. The weight of the edges represents the distance of the bike route between locations.
- Use the traveling salesperson algorithm to calculate the optimal delivery route.
Subsection 7.6.2 Locations
| Name | Address |
|---|---|
| Harold Washington College | 30 E. Lake Street, Chicago, IL 60601 |
| Harry Truman College | 1145 West Wilson Ave, Chicago, IL 60640 |
| Kennedy-King College | 6301 South Halsted St, Chicago, IL 60621 |
| Malcolm X College | 1900 W. Jackson, Chicago, IL 60612 |
| Olive-Harvey College | 10001 South Woodlawn Ave, Chicago, IL 60628 |
| Richard J. Daley College | 7500 South Pulaski Rd, Chicago, IL 60652 |
| Wilbur Wright College | 4300 N. Narragansett Ave, Chicago, IL 60634 |

Subsection 7.6.3 Graph
We will represent each College as a node with the initials of the College name. The weight of the edge will represent the miles in between the locations. Since we are using bike routes, we are assuming each direction between two locations has the same distance. For example, express the route between Harold Washington College and Harry Truman College as
("HW", "HT", 6.5).Create a
Graph from the edge list:The trailing zeros of the floating point values are hard to read. Let’s loop through the edge
list and display the numbers with \(3\) points of precision.Since this graph is not planar, improve the layout with the
"circular" parameter. We can also improve the readability by increasing the vertex_size and figsize.Now that we have a clearer idea of the routes, let’s find the most efficient delivery route using the traveling salesperson algorithm.
We can set the vertex positions to resemble their positions on the map. We can use the latitude and longitude values of the locations and then reverse them when we supply the values to the position
dictionary.
